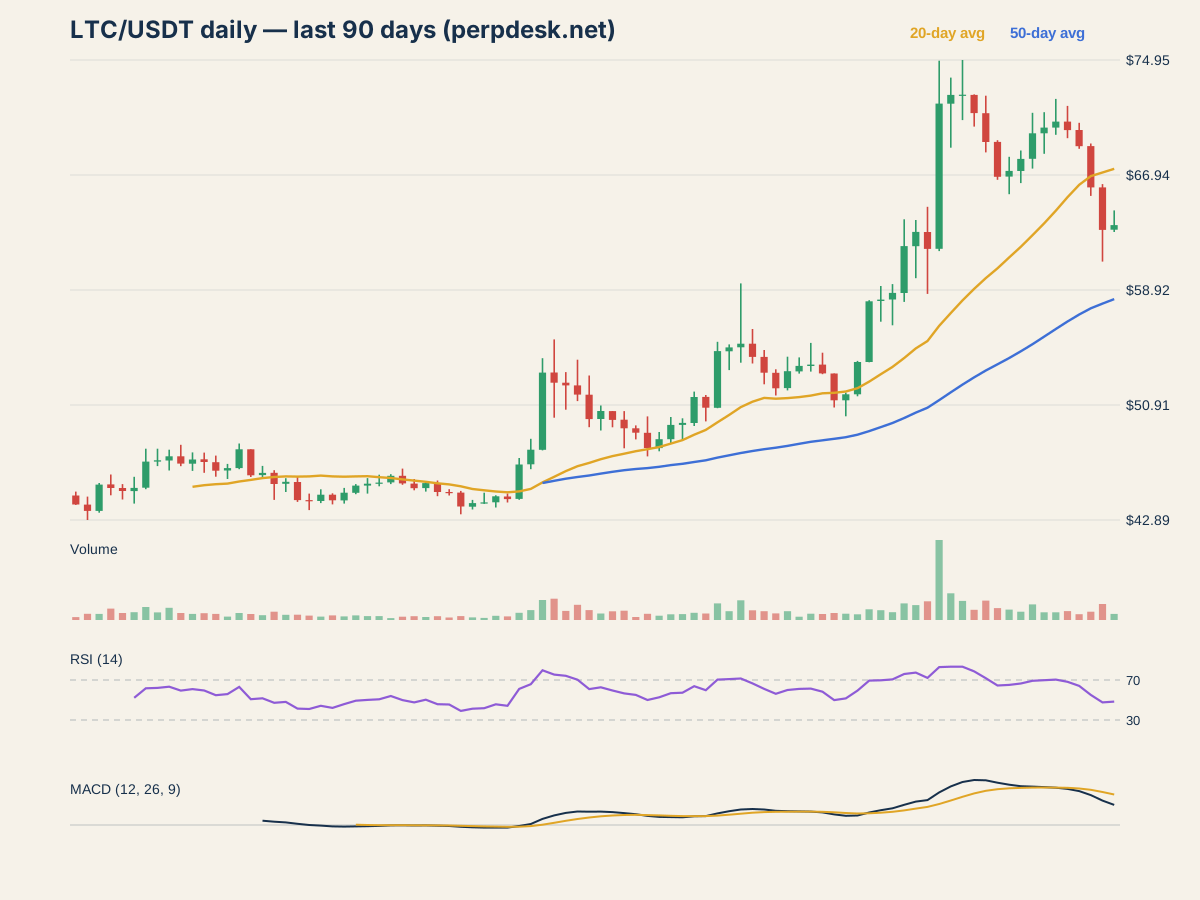
The daily candle
Litecoin closed the October 9 daily candle at $63.44, up 0.52% on the day, after trading between $62.96 and $64.47.
Moving averages
The close of $63.44 is 5.8% below the 20-day average ($67.37).
The close of $63.44 is 8.8% above the 50-day average ($58.29).
Momentum: RSI and MACD
The 14-day RSI reads 48.4, between 30 and 70, neither extreme. RSI compares the size of recent up days with recent down days on a 0 to 100 scale.
MACD (12, 26, 9) is 2.369 against a signal line of 3.593, so the MACD line is below its signal. MACD measures the gap between a fast and a slow exponential average.
Volume and range
Volume on the day was 0.38 times its 20-day average. Volume counts how much traded; a move on heavy volume involved more of the market than one on light volume.
The Bollinger Bands (20 days, 2 standard deviations) run from $59.40 to $75.34, and the close is inside the bands.
Over the previous 30 days the highest close was $72.53 and the lowest $51.23.
What it costs to hold a position
Anyone holding a LTC perpetual future pays or receives funding every settlement, and the rate differs by exchange. Today's rates across venues are on the LTC funding page.