Next funding settles in --:--:--Same $10,000 PUMP long, one week: $49 more on Bitget than on OKXOpen OKX →

· four exchange APIs · rebuilt daily

Dogecoin Sits 9.6% Above Its 50-Day Average, RSI 58 — Daily Chart Oct 4

2026-10-04 · Dogecoin daily chart

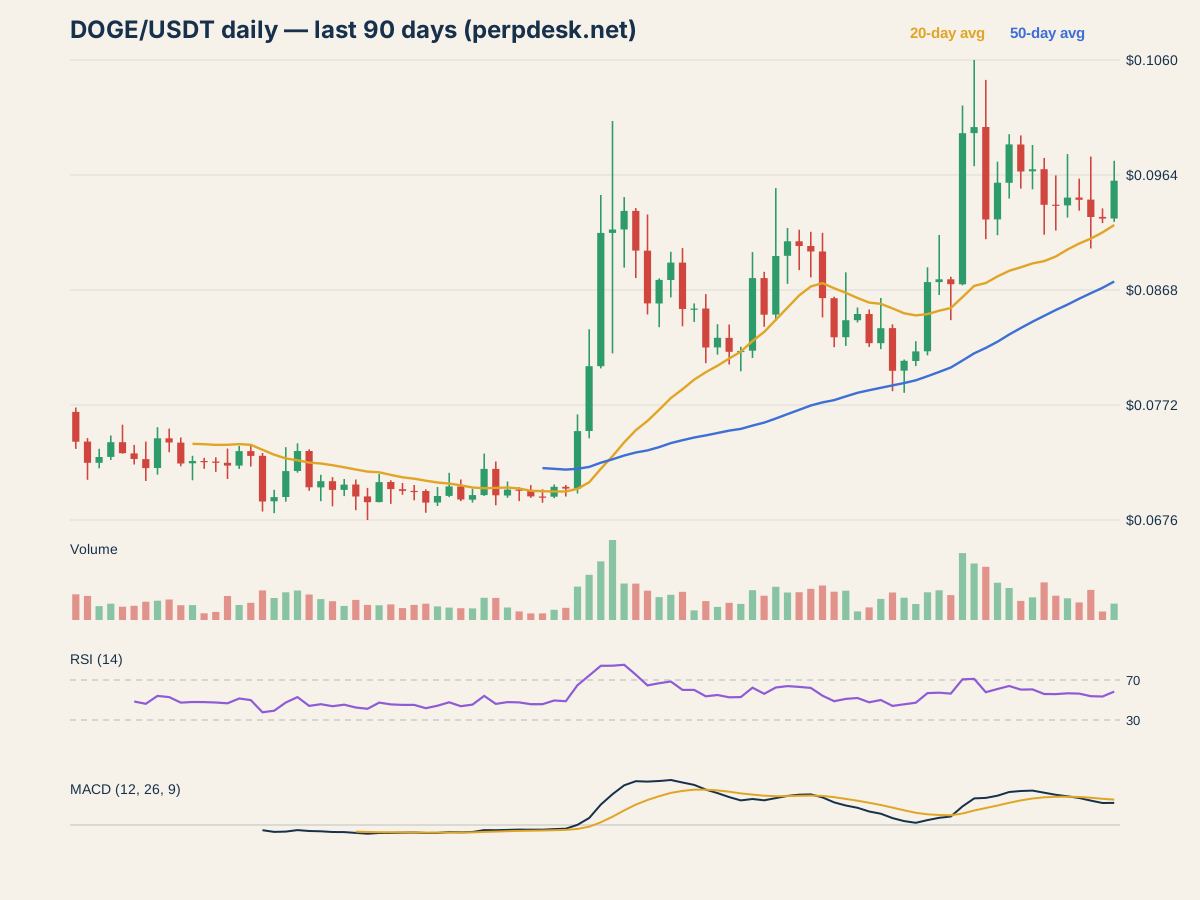
DOGE daily chart: candles, 20- and 50-day averages, volume, RSI and MACD

The daily candle

Dogecoin closed the October 4 daily candle at $0.0959, up 3.41% on the day, after trading between $0.0925 and $0.0976.

Moving averages

The close of $0.0959 is 4.0% above the 20-day average ($0.0922).

The close of $0.0959 is 9.6% above the 50-day average ($0.0875).

Momentum: RSI and MACD

The 14-day RSI reads 58.4, between 30 and 70, neither extreme. RSI compares the size of recent up days with recent down days on a 0 to 100 scale.

MACD (12, 26, 9) is 0.002448 against a signal line of 0.002818, so the MACD line is below its signal. MACD measures the gap between a fast and a slow exponential average.

Volume and range

Volume on the day was 0.55 times its 20-day average. Volume counts how much traded; a move on heavy volume involved more of the market than one on light volume.

The Bollinger Bands (20 days, 2 standard deviations) run from $0.0803 to $0.1041, and the close is inside the bands.

Over the previous 30 days the highest close was $0.1004 and the lowest $0.0800.

What it costs to hold a position

Anyone holding a DOGE perpetual future pays or receives funding every settlement, and the rate differs by exchange. Today's rates across venues are on the DOGE funding page.

DOGE funding rates across exchanges, today

More daily charts

Avalanche Sits 30.7% Above Its 50-Day Average, RSI 65 — Daily Chart Oct 4Avalanche closed the October 4 daily candle at $11.10, down 0.19% on the day, after trading…Bitcoin Sits 9.5% Above Its 50-Day Average, RSI 69 — Daily Chart Oct 4Bitcoin closed the October 4 daily candle at $86,485, up 2.08% on the day, after trading…BNB Sits 9.7% Above Its 50-Day Average, RSI 65 — Daily Chart Oct 4BNB closed the October 4 daily candle at $795.10, up 1.09% on the day, after trading between…Cardano Rips 6.6% in One Day to $0.2598 — Daily Chart Oct 4Cardano closed the October 4 daily candle at $0.2598, up 6.61% on the day, after trading…Chainlink MACD Flips Down: Up 1.1% to $14.27 — Daily Chart Oct 4Chainlink closed the October 4 daily candle at $14.27, up 1.14% on the day, after trading…Ethereum Sits 9.0% Above Its 50-Day Average, RSI 64 — Daily Chart Oct 4Ethereum closed the October 4 daily candle at $2,726, up 1.48% on the day, after trading…Hyperliquid Sits 8.8% Above Its 50-Day Average, RSI 56 — Daily Chart Oct 4Hyperliquid closed the October 4 daily candle at $90.53, up 1.40% on the day, after trading…Litecoin RSI Hits 70: Overheated at $70.66? — Daily Chart Oct 4Litecoin closed the October 4 daily candle at $70.66, up 0.60% on the day, after trading…Solana Sits 16.1% Above Its 50-Day Average, RSI 66 — Daily Chart Oct 4Solana closed the October 4 daily candle at $121.52, up 1.66% on the day, after trading…Sui Sits 40.0% Above Its 50-Day Average, RSI 67 — Daily Chart Oct 4Sui closed the October 4 daily candle at $1.21, up 2.04% on the day, after trading between…XRP Sits 8.9% Above Its 50-Day Average, RSI 59 — Daily Chart Oct 4XRP closed the October 4 daily candle at $1.52, up 2.34% on the day, after trading between…Dogecoin Sits 6.6% Above Its 50-Day Average, RSI 54 — Daily Chart Oct 3Dogecoin closed the October 3 daily candle at $0.0927, down 0.14% on the day, after trading…Dogecoin Sits 7.3% Above Its 50-Day Average, RSI 54 — Daily Chart Oct 2Dogecoin closed the October 2 daily candle at $0.0929, down 1.53% on the day, after trading…Dogecoin MACD Flips Down: Down 0.2% to $0.0943 — Daily Chart Oct 1Dogecoin closed the October 1 daily candle at $0.0943, down 0.19% on the day, after trading…Dogecoin Sits 10.4% Above Its 50-Day Average, RSI 57 — Daily Chart Sep 30Dogecoin closed the September 30 daily candle at $0.0945, up 0.68% on the day, after trading…Dogecoin Sits 10.3% Above Its 50-Day Average, RSI 56 — Daily Chart Sep 29Dogecoin closed the September 29 daily candle at $0.0939, down 0.04% on the day, after trading…Dogecoin Sits 10.9% Above Its 50-Day Average, RSI 56 — Daily Chart Sep 28Dogecoin closed the September 28 daily candle at $0.0939, down 3.06% on the day, after trading…