Perp Desk Next funding settles in --:--:-- Same $10,000 SOXL long, one week: $30 more on Bitget than on MEXC Open MEXC → Read 2026-11-14 · four exchange APIs · rebuilt daily
Ethereum Price Today: ETH Daily Chart Analysis
Latest daily close (November 13, 2026): $1,929 (−4.4%) · full reading · Why is Ethereum down today?
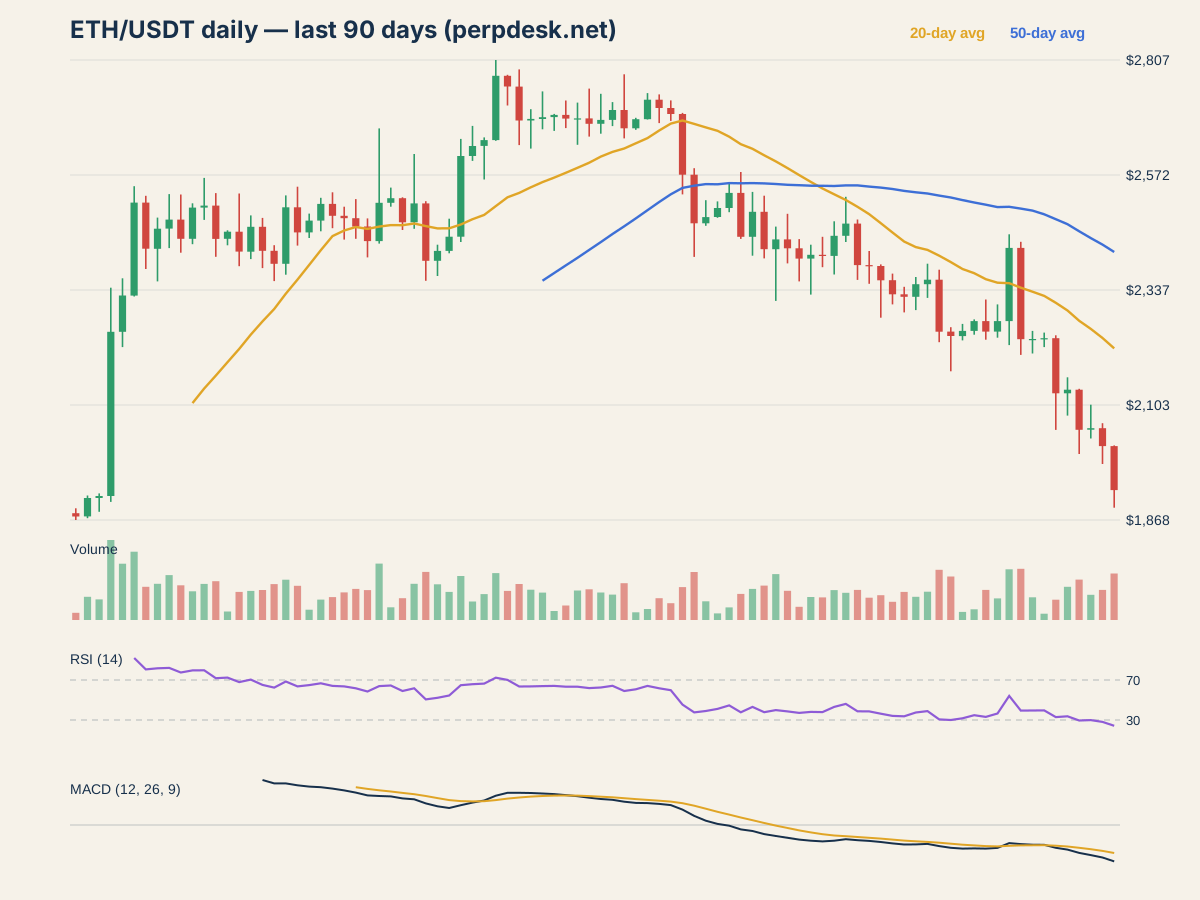
The daily candle Ethereum closed the November 13 daily candle at $1,929, down 4.45% on the day, after trading between $1,893 and $2,020. What stands out on the daily chart: 30-day closing low, RSI oversold.
Moving averages The close of $1,929 is 13.0% below the 20-day average ($2,218).
The close of $1,929 is 20.1% below the 50-day average ($2,415).
Momentum: RSI and MACD The 14-day RSI reads 24.2, below 30, the range usually called oversold. RSI compares the size of recent up days with recent down days on a 0 to 100 scale.
MACD (12, 26, 9) is -108.6 against a signal line of -83.61, so the MACD line is below its signal. MACD measures the gap between a fast and a slow exponential average.
Volume and range Volume on the day was 1.58 times its 20-day average. Volume counts how much traded; a move on heavy volume involved more of the market than one on light volume.
The Bollinger Bands (20 days, 2 standard deviations) run from $1,970 to $2,466, and the close is below the lower band.
Over the previous 30 days the highest close was $2,473 and the lowest $2,019.
What it costs to hold a position Anyone holding a ETH perpetual future pays or receives funding every settlement, and the rate differs by exchange. Today's rates across venues are on the ETH funding page.
Earlier days Ethereum Sinks to a 30-Day Closing Low: $1,929 — Daily Chart Nov 13 Ethereum closed the November 13 daily candle at $1,929, down 4.45% on the day, after trading… Ethereum Sinks to a 30-Day Closing Low: $2,019 — Daily Chart Nov 12 Ethereum closed the November 12 daily candle at $2,019, down 1.77% on the day, after trading… Ethereum RSI Crashes to 30: Oversold at $2,055? — Daily Chart Nov 11 Ethereum closed the November 11 daily candle at $2,055, up 0.15% on the day, after trading… Ethereum Sinks to a 30-Day Closing Low: $2,052 — Daily Chart Nov 10 Ethereum closed the November 10 daily candle at $2,052, down 3.83% on the day, after trading… Ethereum Sits 13.7% Below Its 50-Day Average, RSI 34 — Daily Chart Nov 9 Ethereum closed the November 9 daily candle at $2,134, up 0.34% on the day, after trading… Ethereum Plunges 5.0% in One Day to $2,127 — Daily Chart Nov 8 Ethereum closed the November 8 daily candle at $2,127, down 5.02% on the day, after trading… Ethereum Sits 10.2% Below Its 50-Day Average, RSI 40 — Daily Chart Nov 7 Ethereum closed the November 7 daily candle at $2,239, up 0.07% on the day, after trading… Ethereum Sits 10.5% Below Its 50-Day Average, RSI 39 — Daily Chart Nov 6 Ethereum closed the November 6 daily candle at $2,237, up 0.02% on the day, after trading… Ethereum Plunges 7.7% in One Day to $2,237 — Daily Chart Nov 5 Ethereum closed the November 5 daily candle at $2,237, down 7.69% on the day, after trading… Ethereum Rips 6.6% in One Day to $2,423 — Daily Chart Nov 4 Ethereum closed the November 4 daily candle at $2,423, up 6.58% on the day, after trading… Ethereum Sits 9.3% Below Its 50-Day Average, RSI 36 — Daily Chart Nov 3 Ethereum closed the November 3 daily candle at $2,274, up 0.95% on the day, after trading… Ethereum Sits 10.3% Below Its 50-Day Average, RSI 33 — Daily Chart Nov 2 Ethereum closed the November 2 daily candle at $2,253, down 0.94% on the day, after trading… Ethereum Sits 9.6% Below Its 50-Day Average, RSI 35 — Daily Chart Nov 1 Ethereum closed the November 1 daily candle at $2,274, up 0.88% on the day, after trading… Ethereum Sits 10.6% Below Its 50-Day Average, RSI 32 — Daily Chart Oct 31 Ethereum closed the October 31 daily candle at $2,254, up 0.47% on the day, after trading… Ethereum Sinks to a 30-Day Closing Low: $2,243 — Daily Chart Oct 30 Ethereum closed the October 30 daily candle at $2,243, down 0.40% on the day, after trading… Ethereum Sinks to a 30-Day Closing Low: $2,252 — Daily Chart Oct 29 Ethereum closed the October 29 daily candle at $2,252, down 4.50% on the day, after trading… Ethereum Sits 6.9% Below Its 50-Day Average, RSI 39 — Daily Chart Oct 28 Ethereum closed the October 28 daily candle at $2,359, up 0.39% on the day, after trading… Ethereum Sits 7.4% Below Its 50-Day Average, RSI 38 — Daily Chart Oct 27 Ethereum closed the October 27 daily candle at $2,349, up 1.11% on the day, after trading… Ethereum Sinks to a 30-Day Closing Low: $2,324 — Daily Chart Oct 26 Ethereum closed the October 26 daily candle at $2,324, down 0.22% on the day, after trading… Ethereum Sinks to a 30-Day Closing Low: $2,329 — Daily Chart Oct 25 Ethereum closed the October 25 daily candle at $2,329, down 1.22% on the day, after trading… Ethereum Sinks to a 30-Day Closing Low: $2,357 — Daily Chart Oct 24 Ethereum closed the October 24 daily candle at $2,357, down 1.22% on the day, after trading… Ethereum Sinks to a 30-Day Closing Low: $2,387 — Daily Chart Oct 23 Ethereum closed the October 23 daily candle at $2,387, down 0.07% on the day, after trading… Ethereum Sinks to a 30-Day Closing Low: $2,388 — Daily Chart Oct 22 Ethereum closed the October 22 daily candle at $2,388, down 3.43% on the day, after trading… Ethereum Sits 3.1% Below Its 50-Day Average, RSI 46 — Daily Chart Oct 21 Ethereum closed the October 21 daily candle at $2,473, up 1.02% on the day, after trading… Ethereum Sits 4.0% Below Its 50-Day Average, RSI 43 — Daily Chart Oct 20 Ethereum closed the October 20 daily candle at $2,448, up 1.70% on the day, after trading… Ethereum Sits 5.6% Below Its 50-Day Average, RSI 38 — Daily Chart Oct 19 Ethereum closed the October 19 daily candle at $2,407, down 0.10% on the day, after trading… Ethereum Sits 5.5% Below Its 50-Day Average, RSI 38 — Daily Chart Oct 18 Ethereum closed the October 18 daily candle at $2,409, up 0.32% on the day, after trading… Ethereum Sinks to a 30-Day Closing Low: $2,402 — Daily Chart Oct 17 Ethereum closed the October 17 daily candle at $2,402, down 0.86% on the day, after trading… Ethereum Sits 5.1% Below Its 50-Day Average, RSI 39 — Daily Chart Oct 16 Ethereum closed the October 16 daily candle at $2,423, down 0.74% on the day, after trading… Ethereum Volume Explodes to 1.9x Normal as Price Rises 0.8% — Daily Chart Oct 15 Ethereum closed the October 15 daily candle at $2,441, up 0.83% on the day, after trading… Ethereum Sits 5.3% Below Its 50-Day Average, RSI 38 — Daily Chart Oct 14 Ethereum closed the October 14 daily candle at $2,421, down 3.06% on the day, after trading… Ethereum Sits 2.6% Below Its 50-Day Average, RSI 39 — Daily Chart Oct 9 Ethereum closed the October 9 daily candle at $2,486, up 0.51% on the day, after trading… Ethereum Breaks Below Its 50-Day Average at $2,474 — Daily Chart Oct 8 Ethereum closed the October 8 daily candle at $2,474, down 3.85% on the day, after trading… ETH funding rates across exchanges
Not investment advice. This page describes what standard indicators computed from daily candles show. It is not investment advice, not a forecast and not a recommendation to buy, sell or hold anything. Indicators describe the past; they do not tell you what the price will do. Trading perpetual futures with leverage can lose more than you expect, including your whole margin. Make your own decisions, and only with money you can afford to lose.Choose an exchange to check its signup offer Affiliate links: we may earn a commission. Check country availability and offer terms on the exchange before signing up.
Already have an account? A referral offer may not apply to it. Check eligibility before opening another account.
Signup & verification steps
Updated 2026-11-14 · Methodology · Funding · Calculators · Compare · API · Privacy · Terms
Disclosure: this post contains an affiliate link. I receive a share of trading fees from accounts opened through it, at no extra cost to you.
Not financial advice. Leveraged crypto derivatives can lose more than your deposit. Trade only what you can afford to lose, and only where the service is licensed to operate.
Not directed at residents of the United Kingdom, South Korea, the United States, or any jurisdiction where the venues named are not authorised. Nothing here is an invitation or inducement to engage in investment activity.