· four exchange APIs · rebuilt daily
How far from liquidation you are depends on volatility not price
The finding
A 5% price buffer at 20x leverage represents less than one daily standard deviation of price movement for high-volatility perpetual contracts.
Distance measured in dollars creates a false sense of security that ignores asset variance.
Holding a position open for seven days reduces the survival probability of a fixed distance by more than half.
Funding rate drag continuously shifts your liquidation price closer to the mark price every eight hours.
Static percentage is a false safety metric
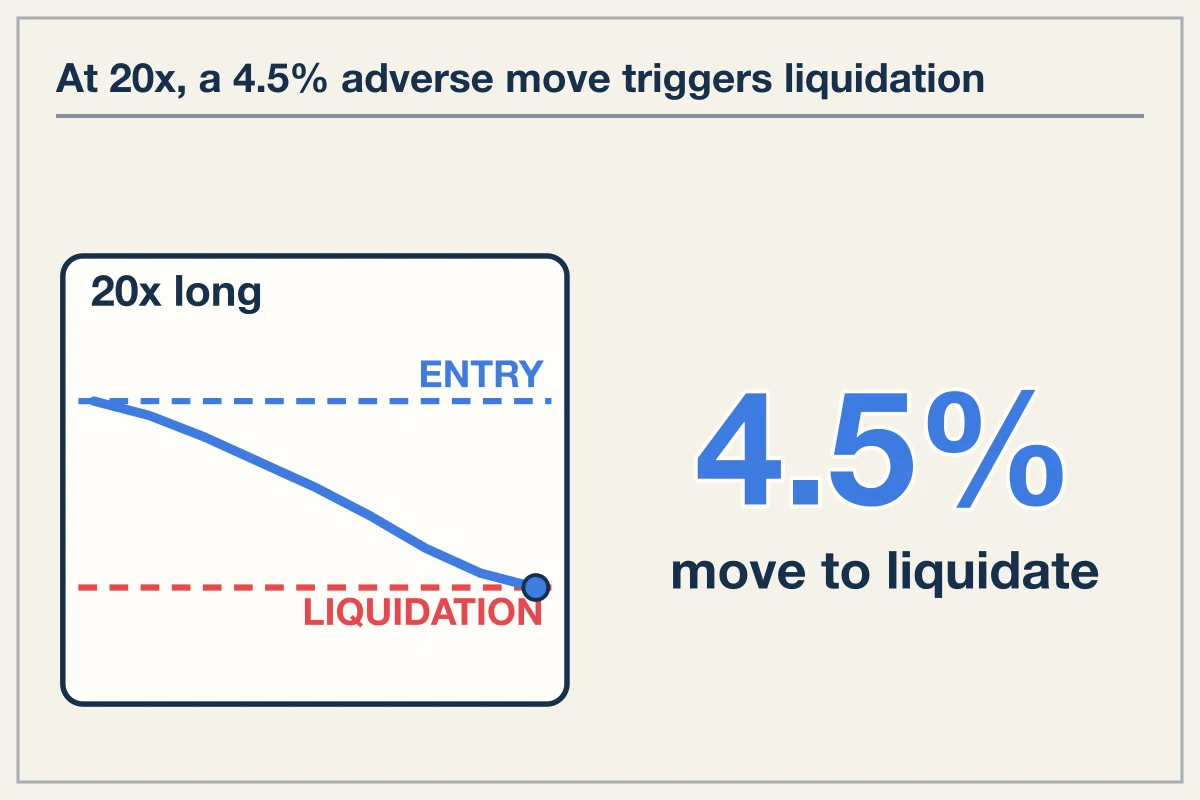
Traders assessing how far from liquidation a position sits usually measure the simple percentage gap between the mark price and the liquidation price. At 20x leverage, your initial margin is 5.0% of nominal position value. Assuming a standard maintenance margin requirement of 0.5%, an adverse price movement of 4.5% triggers automated liquidation.
Counting dollars or raw percentage points assumes market movement occurs in a vacuum. A 4.5% price gap on Bitcoin represents a fundamentally different risk profile than a 4.5% price gap on Zcash or Solana. Liquidation is a threshold trigger executed upon the first instance of mark price touching the maintenance boundary. Because perpetual futures run continuously, probability of liquidation depends on asset volatility and time elapsed rather than static price distance.
Where this goes wrong
Evaluating liquidation risk solely by price distance fails to account for variance. A position set 4.5% away from market price on a high-volatility asset carries a near-certain probability of liquidation over a long holding period.
Calculating how far from liquidation you sit in standard deviations
To calculate how far from liquidation your position actually sits, convert the distance from percentage points into daily standard deviations. If an asset has an annualized volatility of 48%, its daily standard deviation is roughly 2.5%. A 4.5% distance to liquidation equates to 1.8 daily standard deviations.
If you trade an asset like Zcash with higher variance, daily standard deviation often exceeds 8.0%. On that asset, a 4.5% gap represents just 0.56 daily standard deviations. A 0.56-sigma event occurs on approximately 28% of all trading days. What appears to be a comfortable 4.5% safety buffer on a price chart is statistically likely to be wiped out within 72 hours of exposure.
Worth knowing
As duration increases, the probability of reaching a fixed liquidation price approaches 100%. Doubling your holding time increases the likelihood of touching a tight liquidation threshold far more than doubling your leverage.
Funding drag shifts the liquidation threshold
Liquidation price is not fixed at entry. Every eight hours, funding rates settle. When your position pays funding, the exchange deducts the payment directly from your margin collateral. As your margin balance falls, your liquidation price moves closer to the current mark price.
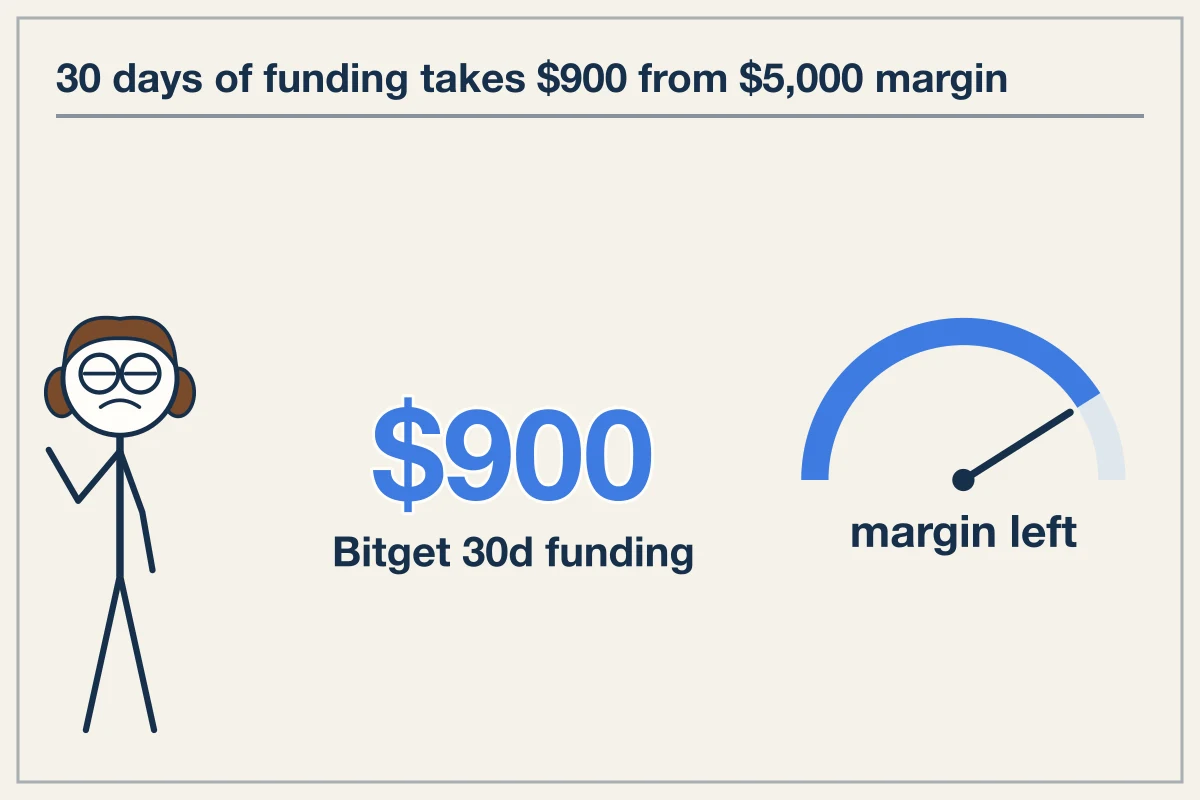
Consider an ETH long position held at 20x leverage with $100,000 nominal size and $5,000 initial margin. On Bitget, the live ETH funding rate is +0.0100% per 8 hours, or 0.0300% per day. On Bybit, the live ETH funding rate is +0.0018% per 8 hours, or 0.0054% per day.
Over 30 days on Bitget, funding payments total $900. That $900 deduction reduces your remaining collateral to $4,100. Without any change in the market price of ETH, your remaining margin buffer drops from 4.5% down to 3.6%. The funding drag pulled your liquidation price 0.90 percentage points closer to your entry.
What to do instead
Account for cumulative 8-hour funding payments when setting stop losses. Subtract projected monthly funding costs from your initial margin before calculating your actual liquidation buffer.
Venue cost impact on position survival
Holding costs vary sharply across perpetual venues. High funding rates accelerate margin decay, shortening the effective distance to liquidation on long-term holdings. The table below shows live funding rates and the resulting 30-day buffer erosion for a 20x long position across major assets and venues.
| Asset | Venue | Funding Rate (8h) | Daily Drag | 30-Day Buffer Erosion | Taker Fee |
|---|---|---|---|---|---|
| ETH | Bybit | +0.0018% | 0.0054% | 0.162% | 0.055% |
| ETH | Bitget | +0.0100% | 0.0300% | 0.900% | 0.030% |
| BTC | OKX | -0.0004% | -0.0012% | -0.036% | 0.050% |
| BTC | Bitget | +0.0058% | 0.0174% | 0.522% | 0.030% |
| ZEC | Bitget | -0.0076% | -0.0228% | -0.684% | 0.030% |
| ZEC | Bybit | +0.0100% | 0.0300% | 0.900% | 0.055% |
| SOL | Bybit | +0.0024% | 0.0072% | 0.216% | 0.055% |
| SOL | Bitget | +0.0100% | 0.0300% | 0.900% | 0.030% |
On Bitget ETH longs, funding erodes 0.900% of nominal position value over 30 days. On Bybit ETH longs, the erosion is 0.162%. For a 20x position with a 4.5% starting safety margin, holding on Bitget consumes 20% of your total liquidation buffer in 30 days purely through funding settlement.
How far from liquidation am I at 10x leverage?
At 10x leverage, your initial margin is 10% of nominal position size. Assuming a 0.5% maintenance margin requirement, your liquidation price sits exactly 9.5% away from your entry price before accounting for fees or funding deductions.
Does funding rate change my liquidation price over time?
Yes. When your position pays funding, collateral is deducted directly from your margin balance every eight hours. Lower collateral raises the liquidation price on long positions and lowers it on short positions, shifting the liquidation threshold closer even if mark price remains completely flat.
Why does asset volatility matter more than price distance for liquidation risk?
Price distance only measures static margin depth, whereas volatility measures the probability of price reaching that margin boundary. A 5% price gap on a low-volatility asset may represent two daily standard deviations, while the same 5% gap on a high-volatility asset may represent less than half a daily standard deviation, making liquidation far more likely.