· four exchange APIs · rebuilt daily
Leverage Turns Static Liquidation Price Targets Into Time Decay
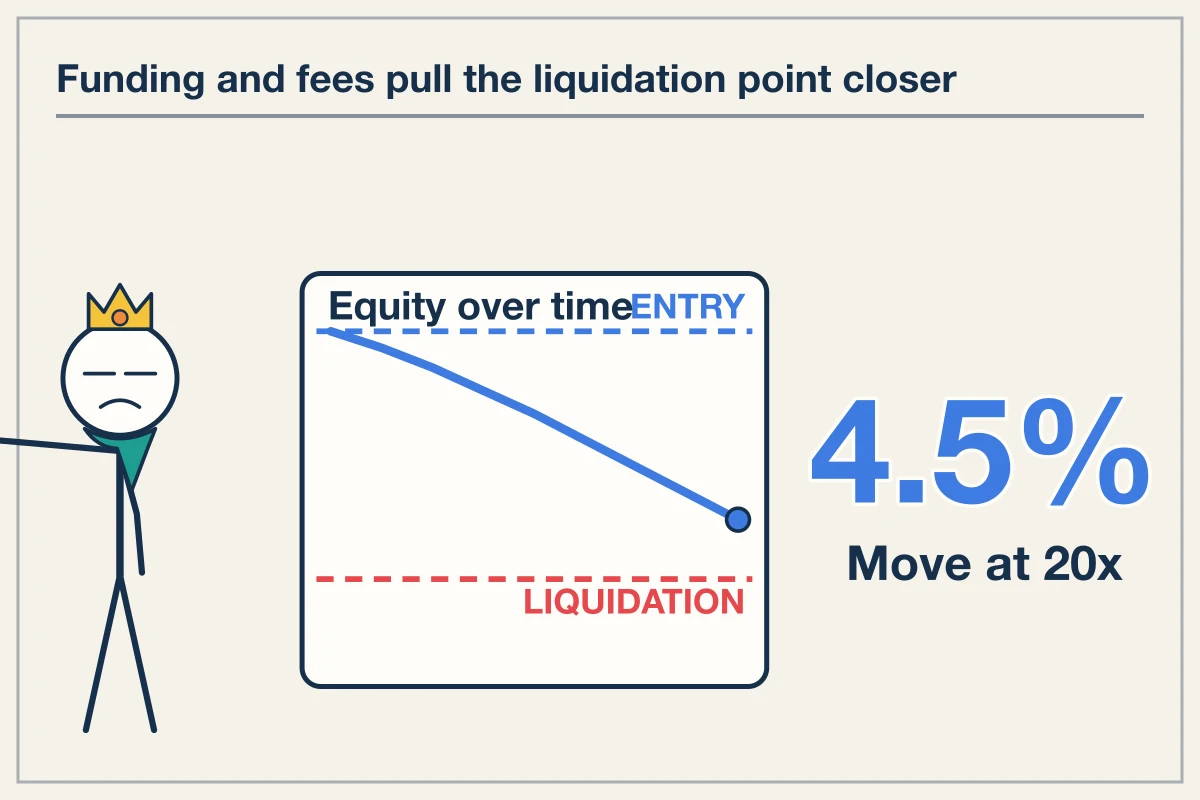
At 20x leverage, a 4.5% price move liquidates equity, but cumulative funding payments and execution fees cause that liquidation price to drift closer every 8 hours.
Dynamic Distance to Liquidation
At 20x leverage, a 4.5% adverse price move liquidates a position, but holding that position across high-rate venues causes cumulative funding charges to reduce that buffer continuously. Traders frequently treat liquidation as a fixed price level marked on a chart. In perpetual futures engines, liquidation triggers when account equity falls below the exchange maintenance margin requirement. Equity is dynamic. It changes whenever funding payments settle or trading fees execute.
When you open a long position, your distance to liquidation shrinks with every tick of negative price action, every fee deduction, and every positive funding rate interval paid to short holders. Viewing liquidation purely as a static price point ignores how time and venue-specific fee structures reduce the required market move to force a margin call.
Leverage and the Required Price Move
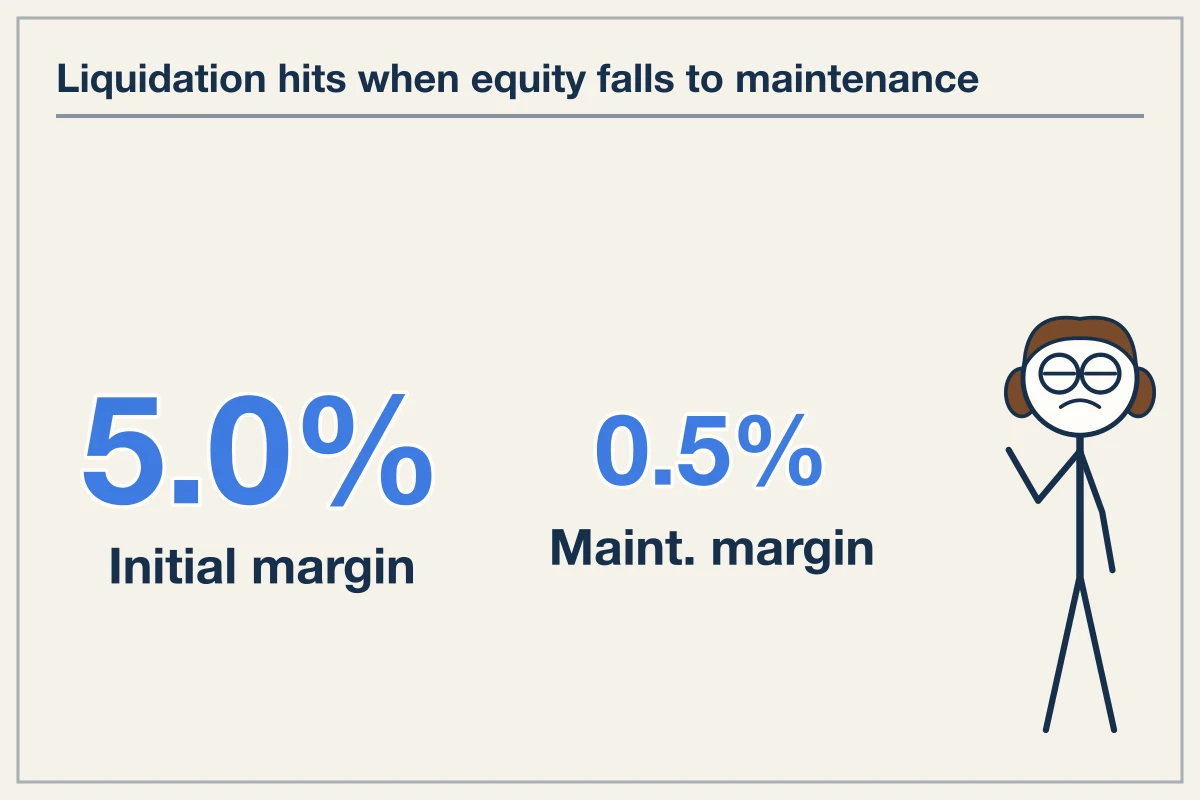
Leverage scales initial equity down relative to total position size, reducing the exact percentage move required to trigger a liquidation event. Assuming a base maintenance margin requirement of 0.5% of position value, the distance between entry and liquidation shrinks rapidly as leverage increases.
At 10x leverage, initial margin is 10.0% of position value. An adverse price move of 9.5% reduces remaining equity to 0.5%, triggering liquidation.
At 20x leverage, initial margin is 5.0% of position value. An adverse price move of 4.5% reduces remaining equity to 0.5%, triggering liquidation.
At 50x leverage, initial margin is 2.0% of position value. An adverse price move of 1.5% reduces remaining equity to 0.5%, triggering liquidation.
At 100x leverage, initial margin is 1.0% of position value. An adverse price move of 0.5% reduces remaining equity to 0.5%, triggering liquidation.
When leverage moves from 10x to 100x, the price move required to wipe out equity decreases by a factor of 19. At 100x leverage, normal bid-ask spread expansion or minor order book slippage can trigger liquidation without any sustained market trend.
Funding and Fee Friction Across Venues
Perpetual contract holding costs differ by asset and venue. Fee schedules and current 8-hour funding rates dictate the speed at which position equity decays over time.
| Asset | Venue | 8h Funding Rate | Futures Taker Fee | Futures Maker Fee | 24h Volume |
|---|---|---|---|---|---|
| BTC | Bitget | +0.0031% | 0.030% | 0.020% | 2,249,259,466 USD |
| BTC | OKX | +0.0050% | 0.050% | 0.020% | 2,249,259,466 USD |
| BTC | Bybit | +0.0070% | 0.055% | 0.020% | 2,249,259,466 USD |
| BTC | MEXC | +0.0100% | 0.020% | 0.000% | 2,249,259,466 USD |
| SOL | Bybit | -0.0020% | 0.055% | 0.020% | 733,413,722 USD |
| SOL | OKX | -0.0018% | 0.050% | 0.020% | 733,413,722 USD |
| SOL | MEXC | +0.0012% | 0.020% | 0.000% | 733,413,722 USD |
| SOL | Bitget | +0.0049% | 0.030% | 0.020% | 733,413,722 USD |
| TRUMP | Bybit | -0.0061% | 0.055% | 0.020% | 554,917,806 USD |
| TRUMP | OKX | -0.0008% | 0.050% | 0.020% | 554,917,806 USD |
| TRUMP | Bitget | +0.0038% | 0.030% | 0.020% | 554,917,806 USD |
| ZEC | Bybit | +0.0100% | 0.055% | 0.020% | 419,874,187 USD |
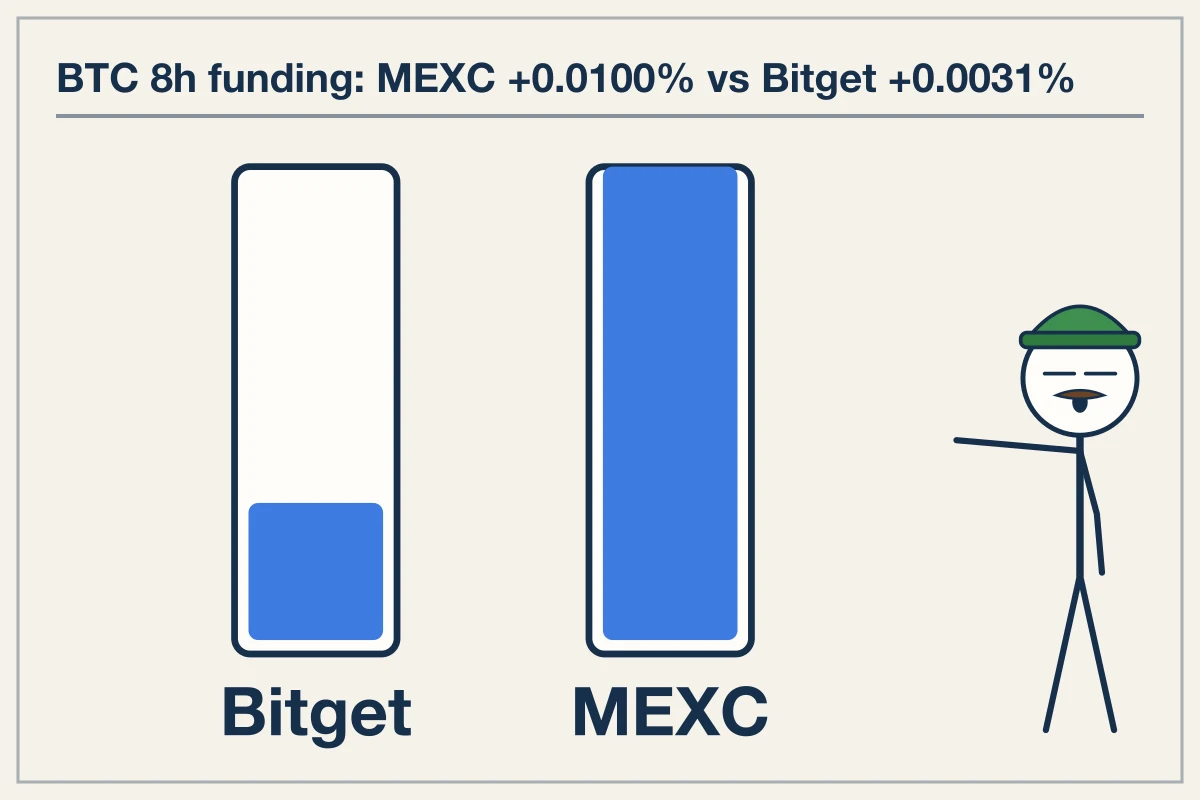
For BTC, the funding spread across venues is 0.0069 percentage points per 8-hour interval. Holding a BTC long on Bitget costs 0.0031% per interval, compared to 0.0100% on MEXC. Over a 30-day period (90 funding intervals), a long position on MEXC pays 0.9000% of total position value in funding, while the same position on Bitget pays 0.2790%.
SOL Long Worked Example
Consider a 10,000 USD position on SOL entered at 20x leverage (500 USD initial margin, 5.0% margin ratio) with a 0.5% maintenance margin requirement (50 USD).
If entered on Bybit using a market order, the taker fee is 0.055% of position size, which equals 5.50 USD. This immediately reduces position margin to 494.50 USD.
If held on Bitget for 10 days (30 funding intervals), the SOL funding rate of +0.0049% per 8 hours requires paying 0.0049% * 30 = 0.1470% of position size. On a 10,000 USD position, this equals 14.70 USD in cumulative funding charges.
Total friction costs on Bitget after entry fee (3.00 USD at 0.030% taker rate) and 10 days of funding (14.70 USD) sum to 17.70 USD. Equity falls from 500.00 USD to 482.30 USD.
With equity at 482.30 USD, the account is 432.30 USD above the 50 USD liquidation floor. Divided by the 10,000 USD position size, the price drop needed to trigger liquidation is now 4.323%, down from the initial 4.500%.
If held on Bybit over the same period, the SOL funding rate is -0.0020% per 8 hours. The long position receives 0.0020% * 30 = 0.0600% of position size, or 6.00 USD in funding income. Subtracting the initial taker fee of 5.50 USD leaves equity at 500.50 USD. The distance to liquidation expands slightly to 4.505%.
Volatility and Time Horizon Impact
Liquidation risk is a function of price volatility over time. Assets with lower 24-hour volume often exhibit wider bid-ask spreads and higher volatility spikes. BTC recorded 2,249,259,466 USD in 24-hour volume, compared to 554,917,806 USD for TRUMP and 419,874,187 USD for ZEC.
A 1.5% price move (the distance to liquidation at 50x leverage) occurs with far higher statistical frequency across a 7-day window than across a 1-hour window. Because funding debits occur every 8 hours, holding high-leverage positions across extended horizons guarantees that time decay will shrink the liquidation distance, increasing the probability that normal market noise crosses the liquidation price threshold.