· four exchange APIs · rebuilt daily
A 5 percent distance to liquidation carries vastly different probability
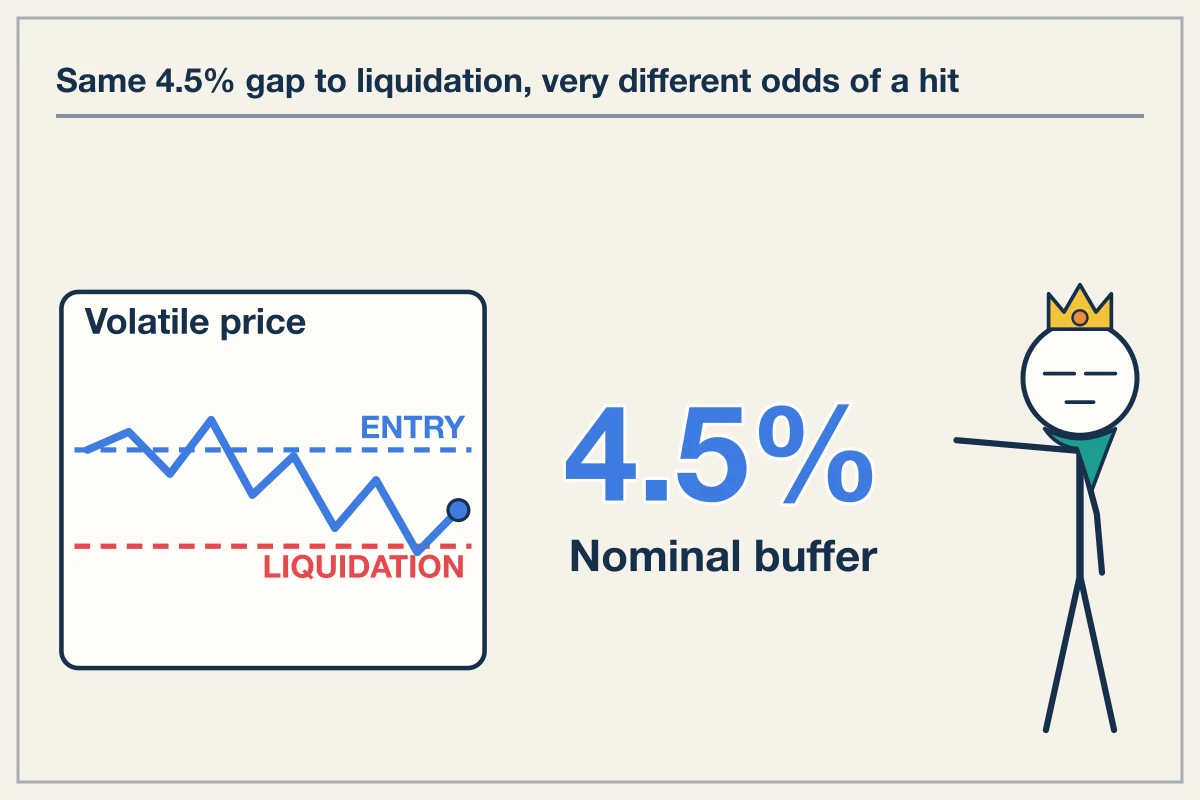
Fixed price liquidation thresholds decay over time as volatility, execution fees, and funding rates dynamically shift the real boundary to forced exit.
Distance to Liquidation as a Dynamic Threshold
At 20x leverage with a 0.5% maintenance margin requirement, a 4.5% adverse price movement triggers liquidation. Traders frequently treat this 4.5% gap as a fixed buffer. In live trading, price distance is a static measurement applied to a dynamic stochastic process. The probability of touching a liquidation price depends on asset volatility, expected holding period, and cumulative friction costs rather than nominal price distance alone.
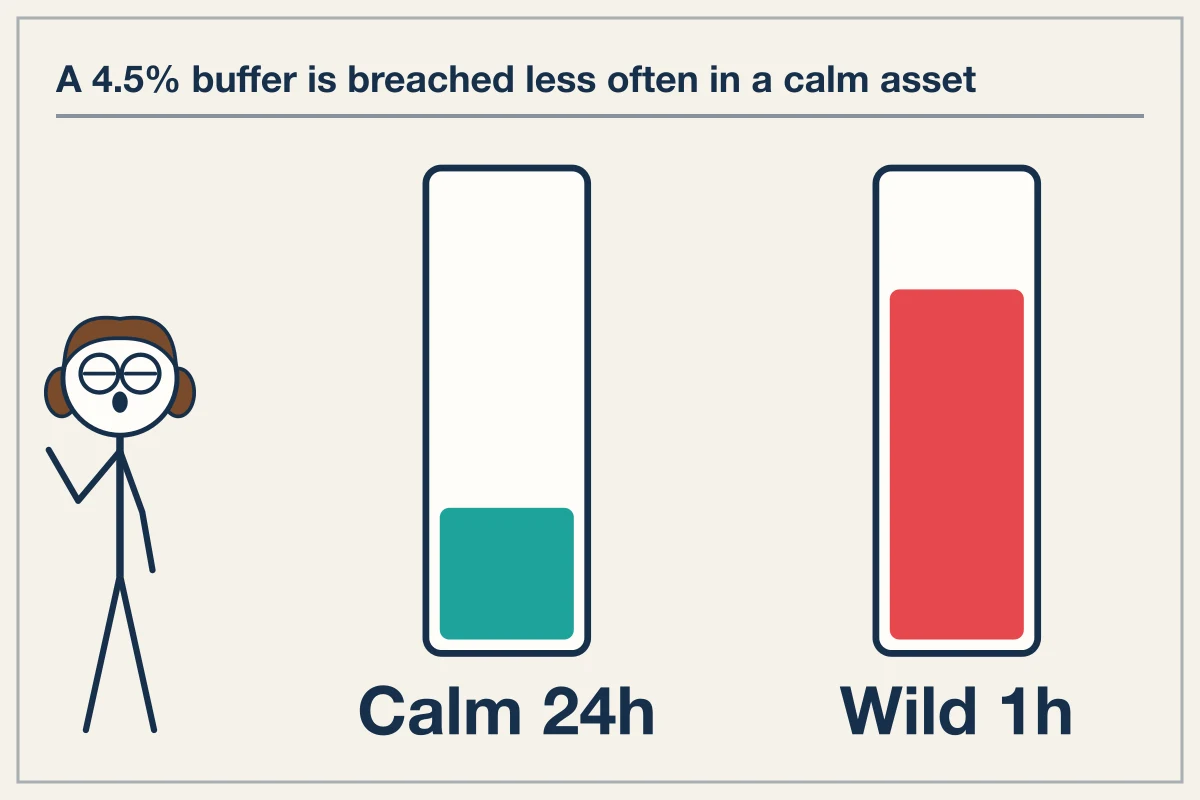
When asset volatility rises, the probability of hitting a 4.5% price gap over a given timeframe increases without any change in position size or liquidation price. A 4.5% price buffer in a low-volatility asset carries a lower probability of breach over a 24-hour horizon than the same 4.5% buffer in a high-volatility asset over a 1-hour horizon.
Calculating the Impact of Leverage and Margin
Liquidation distance without fees or funding is determined by initial leverage and the exchange maintenance margin rate. The ratios function as follows:
- 10x leverage: 10.0% initial margin. With 0.5% maintenance margin, liquidation occurs at a 9.5% price decline.
- 20x leverage: 5.0% initial margin. With 0.5% maintenance margin, liquidation occurs at a 4.5% price decline.
- 50x leverage: 2.0% initial margin. With 0.5% maintenance margin, liquidation occurs at a 1.5% price decline.
Consider an account entering a long position on an asset priced at 100 dollars with 1,000 dollars of margin at 20x leverage. Total position nominal value is 20,000 dollars, representing 200 units. The exchange maintenance margin is 0.5%, requiring 100 dollars minimum account equity (20,000 dollars multiplied by 0.005).
The maximum tolerable account equity loss is 900 dollars (1,000 dollars initial margin minus 100 dollars maintenance margin). Dividing 900 dollars loss by 200 units yields a maximum per-unit price decline of 4.50 dollars. The liquidation price is set at 95.50 dollars, exactly 4.5% below entry.
Funding Rate Drag on Liquidation Thresholds
Holding a position over multiple settlement intervals shifts the effective liquidation price closer to entry through funding rate deductions. Funding payments reduce equity directly from the margin balance when holding a position aligned with positive funding rates.
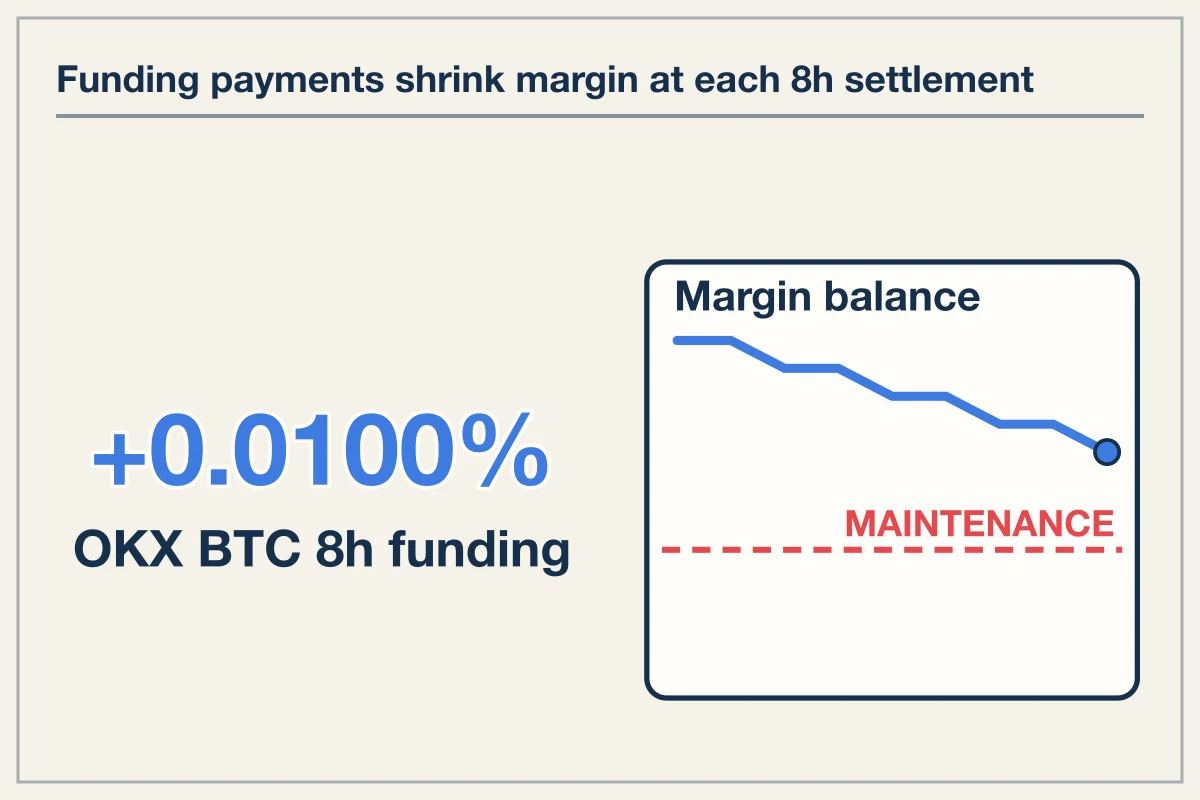
Published funding rates across perpetual venues display notable divergence:
| Venue | Futures Maker Fee | Futures Taker Fee | BTC 8h Funding Rate | ETH 8h Funding Rate | SOL 8h Funding Rate |
|---|---|---|---|---|---|
| MEXC | 0.000% | 0.020% | +0.0053% | +0.0095% | -0.0061% |
| Bitget | 0.020% | 0.030% | +0.0056% | +0.0100% | -0.0097% |
| OKX | 0.020% | 0.050% | +0.0100% | +0.0088% | -0.0003% |
| Bybit | 0.020% | 0.055% | N/A | N/A | N/A |
Holding the 20,000 dollar BTC long position on OKX for 30 days involves 90 funding settlements at +0.0100% per 8 hours. Total funding paid equals 90 multiplied by 0.0001 multiplied by 20,000 dollars, which totals 180 dollars.
If entry price remains flat, account equity decreases from 1,000 dollars to 820 dollars. Remaining tolerable equity loss decreases to 720 dollars (820 dollars minus 100 dollars maintenance margin). Dividing 720 dollars by 200 units yields a remaining loss capacity of 3.60 dollars per unit. The new effective liquidation price rises to 96.40 dollars.
The distance to liquidation shrinks from 4.5% to 3.6% purely through 30 days of funding drag, without any movement in underlying market price.
On MEXC, the same position incurs +0.0053% per 8 hours. Over 90 periods, funding total is 90 multiplied by 0.000053 multiplied by 20,000 dollars, equaling 95.40 dollars. Remaining loss capacity is 804.60 dollars (904.60 dollars minus 100 dollars), placing the new liquidation price at 95.977 dollars, a 4.023% drop allowance.
Fee Schedules and Execution Overhead
Trading execution fees further erode margin balance upon order entry and forced exit.
Opening a 20,000 dollar position at market rate on OKX incurs a taker fee of 0.050%, or 10 dollars (20,000 multiplied by 0.0005). On Bitget, the taker fee is 0.030%, or 6 dollars. On MEXC, the taker fee is 0.020%, or 4 dollars.
If liquidation occurs, exchange liquidation engines execute forced taker orders. On OKX, closing a 19,100 dollar position (200 units at 95.50 dollars) via taker market order incurs an additional taker fee of 9.55 dollars. Total round-trip fee friction on OKX is 19.55 dollars, reducing available margin buffer from inception.
Practical Consequence for Positions
Distance to liquidation is not a static price level. Higher leverage non-linearly compresses nominal distance to liquidation, while funding drag and taker fee overhead steadily compress effective distance over time. A position held for 30 days at 20x leverage on positive funding exhibits a higher real breach probability than indicated by the initial order confirmation screen. Account equity decay operates as a continuous inward migration of the liquidation boundary.