Next funding settles in --:--:--Same $10,000 SOXL long, one week: $30 more on Bitget than on MEXCOpen MEXC →

· four exchange APIs · rebuilt daily

Dogecoin Price Today: DOGE Daily Chart Analysis

Latest daily close (November 13, 2026): $0.0645 (−3.0%) · full reading · Why is Dogecoin down today?
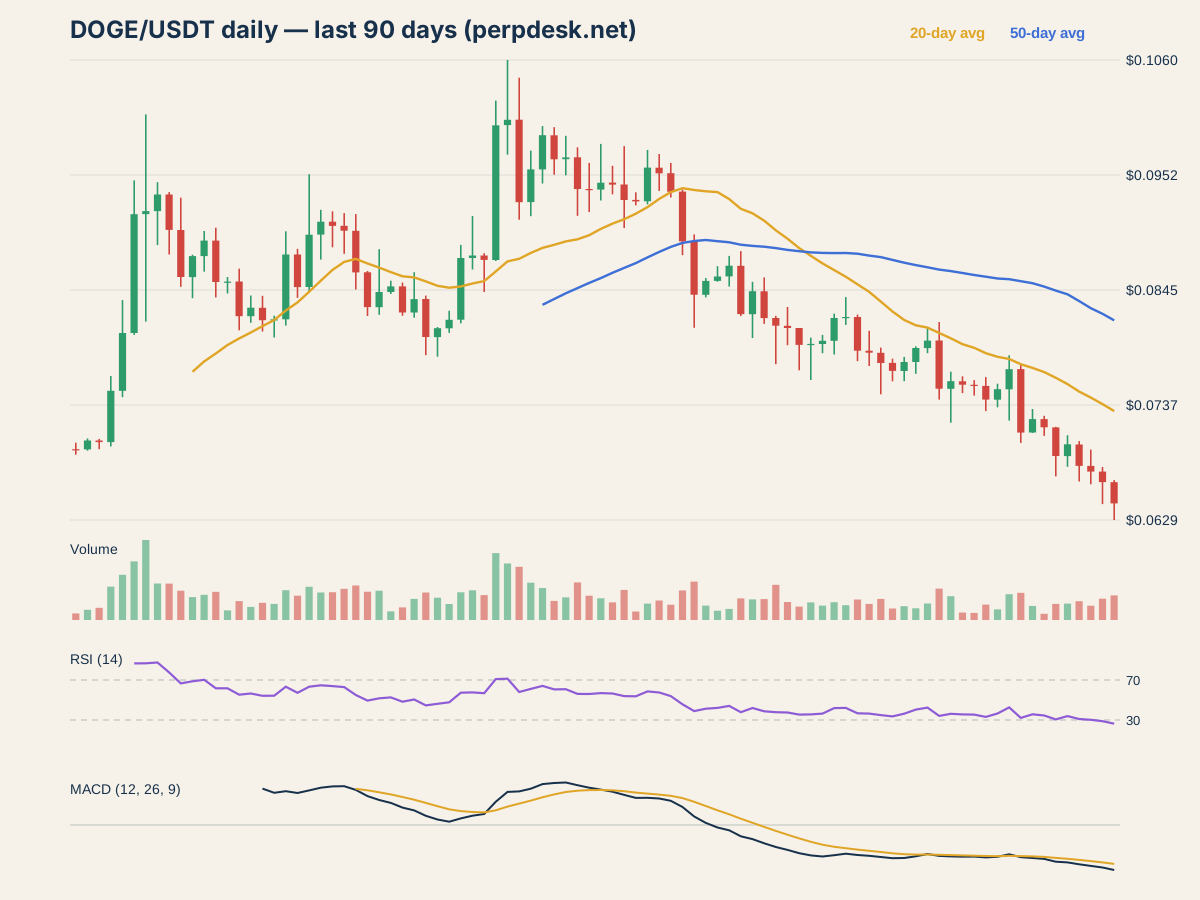
DOGE daily chart for November 13, 2026

The daily candle

Dogecoin closed the November 13 daily candle at $0.0645, down 2.99% on the day, after trading between $0.0629 and $0.0667. What stands out on the daily chart: 30-day closing low, RSI oversold.

Moving averages

The close of $0.0645 is 11.8% below the 20-day average ($0.0731).

The close of $0.0645 is 21.0% below the 50-day average ($0.0816).

Momentum: RSI and MACD

The 14-day RSI reads 26.3, below 30, the range usually called oversold. RSI compares the size of recent up days with recent down days on a 0 to 100 scale.

MACD (12, 26, 9) is -0.004074 against a signal line of -0.003521, so the MACD line is below its signal. MACD measures the gap between a fast and a slow exponential average.

Volume and range

Volume on the day was 1.47 times its 20-day average. Volume counts how much traded; a move on heavy volume involved more of the market than one on light volume.

The Bollinger Bands (20 days, 2 standard deviations) run from $0.0645 to $0.0817, and the close is below the lower band.

Over the previous 30 days the highest close was $0.0819 and the lowest $0.0665.

What it costs to hold a position

Anyone holding a DOGE perpetual future pays or receives funding every settlement, and the rate differs by exchange. Today's rates across venues are on the DOGE funding page.

Earlier days

Dogecoin Sinks to a 30-Day Closing Low: $0.0645 — Daily Chart Nov 13Dogecoin closed the November 13 daily candle at $0.0645, down 2.99% on the day, after trading…Dogecoin Sinks to a 30-Day Closing Low: $0.0665 — Daily Chart Nov 12Dogecoin closed the November 12 daily candle at $0.0665, down 1.45% on the day, after trading…Dogecoin Sinks to a 30-Day Closing Low: $0.0675 — Daily Chart Nov 11Dogecoin closed the November 11 daily candle at $0.0675, down 0.79% on the day, after trading…Dogecoin Sinks to a 30-Day Closing Low: $0.0680 — Daily Chart Nov 10Dogecoin closed the November 10 daily candle at $0.0680, down 2.87% on the day, after trading…Dogecoin Sits 16.7% Below Its 50-Day Average, RSI 34 — Daily Chart Nov 9Dogecoin closed the November 9 daily candle at $0.0700, up 1.58% on the day, after trading…Dogecoin Sinks to a 30-Day Closing Low: $0.0689 — Daily Chart Nov 8Dogecoin closed the November 8 daily candle at $0.0689, down 3.74% on the day, after trading…Dogecoin Sits 15.5% Below Its 50-Day Average, RSI 34 — Daily Chart Nov 7Dogecoin closed the November 7 daily candle at $0.0716, down 1.06% on the day, after trading…Dogecoin Sits 14.9% Below Its 50-Day Average, RSI 36 — Daily Chart Nov 6Dogecoin closed the November 6 daily candle at $0.0724, up 1.77% on the day, after trading…Dogecoin Plunges 7.7% in One Day to $0.0711 — Daily Chart Nov 5Dogecoin closed the November 5 daily candle at $0.0711, down 7.70% on the day, after trading…Dogecoin Volume Explodes to 2.1x Normal as Price Rises 2.5% — Daily Chart Nov 4Dogecoin closed the November 4 daily candle at $0.0770, up 2.50% on the day, after trading…Dogecoin Bollinger Bands Tightest in 60 Days at $0.0752 — Daily Chart Nov 3Dogecoin closed the November 3 daily candle at $0.0752, up 1.31% on the day, after trading…Dogecoin Sinks to a 30-Day Closing Low: $0.0742 — Daily Chart Nov 2Dogecoin closed the November 2 daily candle at $0.0742, down 1.70% on the day, after trading…Dogecoin Sits 12.1% Below Its 50-Day Average, RSI 35 — Daily Chart Nov 1Dogecoin closed the November 1 daily candle at $0.0755, down 0.15% on the day, after trading…Dogecoin Bollinger Bands Tightest in 60 Days at $0.0756 — Daily Chart Oct 31Dogecoin closed the October 31 daily candle at $0.0756, down 0.43% on the day, after trading…Dogecoin Bollinger Bands Tightest in 60 Days at $0.0759 — Daily Chart Oct 30Dogecoin closed the October 30 daily candle at $0.0759, up 0.93% on the day, after trading…Dogecoin Plunges 5.6% in One Day to $0.0752 — Daily Chart Oct 29Dogecoin closed the October 29 daily candle at $0.0752, down 5.64% on the day, after trading…Dogecoin MACD Flips Up: Up 0.9% to $0.0797 — Daily Chart Oct 28Dogecoin closed the October 28 daily candle at $0.0797, up 0.87% on the day, after trading…Dogecoin Bollinger Bands Tightest in 60 Days at $0.0790 — Daily Chart Oct 27Dogecoin closed the October 27 daily candle at $0.0790, up 1.69% on the day, after trading…Dogecoin Sits 10.7% Below Its 50-Day Average, RSI 36 — Daily Chart Oct 26Dogecoin closed the October 26 daily candle at $0.0777, up 1.09% on the day, after trading…Dogecoin Sinks to a 30-Day Closing Low: $0.0769 — Daily Chart Oct 25Dogecoin closed the October 25 daily candle at $0.0769, down 0.97% on the day, after trading…Dogecoin Sinks to a 30-Day Closing Low: $0.0776 — Daily Chart Oct 24Dogecoin closed the October 24 daily candle at $0.0776, down 1.21% on the day, after trading…Dogecoin Sinks to a 30-Day Closing Low: $0.0786 — Daily Chart Oct 23Dogecoin closed the October 23 daily candle at $0.0786, down 0.25% on the day, after trading…Dogecoin Sinks to a 30-Day Closing Low: $0.0788 — Daily Chart Oct 22Dogecoin closed the October 22 daily candle at $0.0788, down 3.84% on the day, after trading…Dogecoin Sits 6.8% Below Its 50-Day Average, RSI 42 — Daily Chart Oct 21Dogecoin closed the October 21 daily candle at $0.0819, up 0.12% on the day, after trading…Dogecoin Sits 6.9% Below Its 50-Day Average, RSI 42 — Daily Chart Oct 20Dogecoin closed the October 20 daily candle at $0.0818, up 2.67% on the day, after trading…Dogecoin Sits 9.4% Below Its 50-Day Average, RSI 36 — Daily Chart Oct 19Dogecoin closed the October 19 daily candle at $0.0797, up 0.37% on the day, after trading…Dogecoin Sits 9.7% Below Its 50-Day Average, RSI 36 — Daily Chart Oct 18Dogecoin closed the October 18 daily candle at $0.0794, up 0.11% on the day, after trading…Dogecoin Sinks to a 30-Day Closing Low: $0.0793 — Daily Chart Oct 17Dogecoin closed the October 17 daily candle at $0.0793, down 1.94% on the day, after trading…Dogecoin Sits 8.3% Below Its 50-Day Average, RSI 37 — Daily Chart Oct 16Dogecoin closed the October 16 daily candle at $0.0809, down 0.27% on the day, after trading…Dogecoin Sits 8.2% Below Its 50-Day Average, RSI 38 — Daily Chart Oct 15Dogecoin closed the October 15 daily candle at $0.0811, down 0.87% on the day, after trading…Dogecoin Sits 7.6% Below Its 50-Day Average, RSI 39 — Daily Chart Oct 14Dogecoin closed the October 14 daily candle at $0.0818, down 2.99% on the day, after trading…Dogecoin Sits 4.3% Below Its 50-Day Average, RSI 41 — Daily Chart Oct 9Dogecoin closed the October 9 daily candle at $0.0853, up 1.55% on the day, after trading…Dogecoin Plunges 5.6% in One Day to $0.0840 — Daily Chart Oct 8Dogecoin closed the October 8 daily candle at $0.0840, down 5.61% on the day, after trading…

DOGE funding rates across exchanges